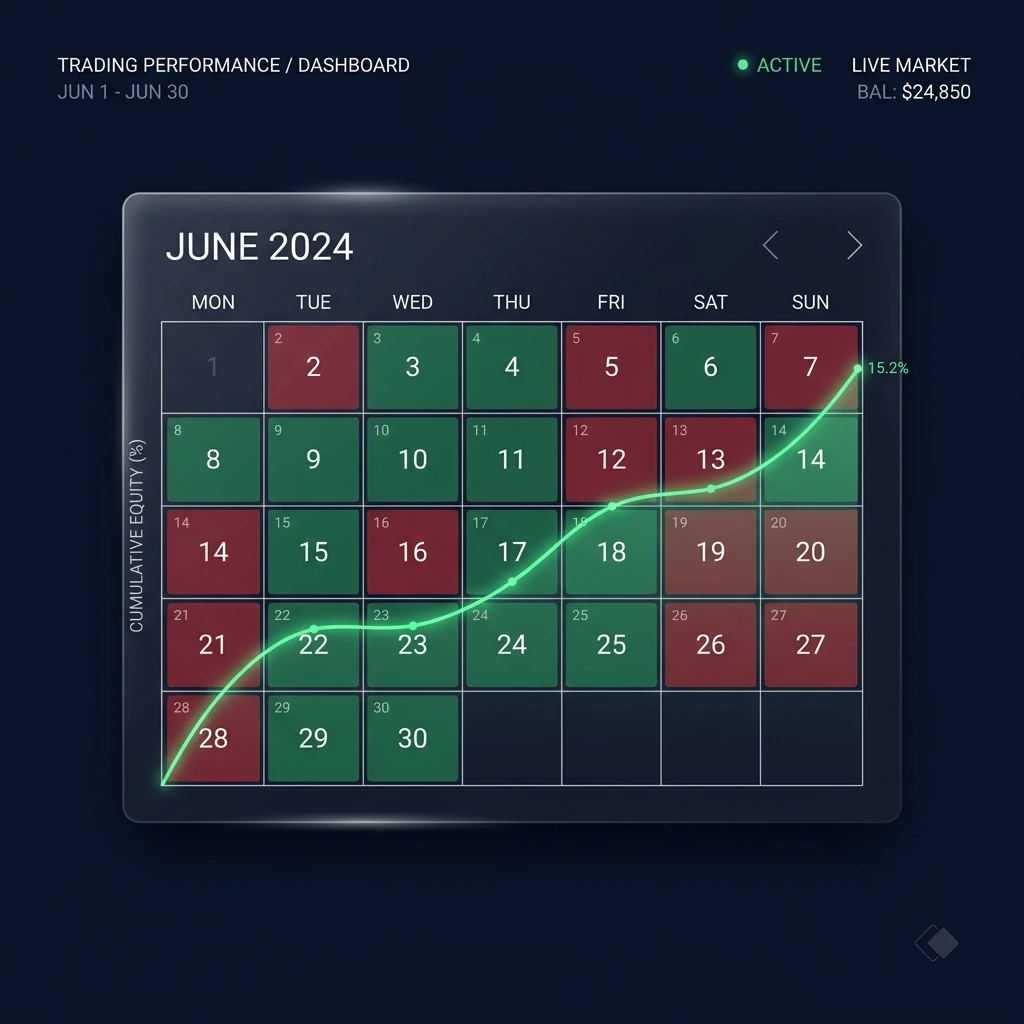
Back in about mid-2021, I glanced at my MT4 statement for the month and found 47 closed trades in a raw list ordered by close time. I understood the month was around breakeven – maybe +1.3R total – but had no idea when things went awry. First week? The days after the CPI release? Friday afternoons? The list wasn't useful to me.
A daily P&L calendar fixes that. Instead of a spreadsheet column, you get a grid where every box is one day. Green days are immediately obvious, red days cluster visually, and your cumulative PnL line stops being an abstraction.
That single change — flipping from a list to a calendar — was the first time I genuinely understood the shape of my trading month rather than just its outcome.
Why a PnL Tracker Needs a Calendar View
Most traders check their account balance at the end of the week and call that "reviewing performance." The problem is that a weekly number collapses five days of behavior into a single figure. A +2% week can hide a -1.8% Wednesday that you clawed back with an unusually lucky Thursday. You'd never know.
A trade P&L calendar makes the structure visible. I started noticing, embarrassingly late in my trading career, that my Fridays into London close were consistently dragging down otherwise solid weeks. Not dramatically — averaging somewhere around -0.4R per session over a rolling 90 days — but steadily enough that cutting Friday afternoon size would have added nearly a full R to my monthly expectancy.
I only saw that because the calendar put red boxes in a pattern I couldn't ignore.
This is different from just tracking your win rate. Win rate tells you how often you're right. A daily PnL calendar tells you when you're consistently wrong.
What Cumulative PnL Actually Shows You
The cumulative PnL line that runs alongside a good daily calendar is underrated. It's not just a vanity equity curve. It answers a specific question: is my account growing at a roughly consistent rate, or are there stretches where I'm flat or declining even though I'm still taking trades?
Long flat stretches in cumulative PnL are often more revealing than drawdown periods. A drawdown at least involves losing. A flat cumulative line while you're actively trading usually means you're chopping — winning and losing roughly the same amount over and over, paying spread each time, and fooling yourself that you're "in the game."
I had a four-day window around the November 2022 CPI and NFP prints where I took eleven trades and ended net -0.1R. Felt productive. Calendar showed four consecutive near-zero days. That cluster of activity with no directional payoff was a clear sign I was forcing setups during high-volatility news conditions that didn't suit my strategy.
Without the calendar, I would've chalked it up to a tough week and moved on. With it, I wrote a rule: no new positions in the two hours before or after a tier-1 news print. My results in similar windows improved the following quarter meaningfully.
How Edgelog Handles Your Daily P&L Calendar
Edgelog's journal includes a daily P&L calendar built into the analytics dashboard — free, no credit card, no trial expiry. Every day you traded shows up as a colored cell. Click a day, and you see the individual trades that made up that session's result.
If you're on MT4 or MT5, the EdgelogSync Expert Advisor pulls your closed positions directly into the journal. You attach the EA to a chart, paste your sync key from Settings → EA Sync, and allow the WebRequest URL — (verify exact EA behavior and latency with dev team before publishing).
The positions show up without manual entry, which matters because manual entry fatigue is the real reason most traders abandon their journals after three weeks.
For Binance, Bybit, and OKX traders, read-only API keys handle the sync. Read-only means exactly that — the connection can read your trade history but cannot place orders or touch withdrawals. Any broker not covered by direct sync works fine through CSV or Excel import, including standard MT4/MT5 account statements.
Once your trades are in, the calendar builds itself. You don't configure anything.
The Tools That Sit Alongside It
Edgelog also has a set of standalone calculators — a profit factor calculator, a win rate calculator, and a risk-reward calculator — that live at their own URLs and run on whatever numbers you type into them. These are manual input tools, full stop. They're not connected to your journal data and don't pull from your trade history.
If you want to check what your profit factor would look like under a different win rate assumption, you type the numbers in yourself. That's genuinely useful for modeling scenarios, but be clear about what they are: calculators, not dashboards.
Your actual cumulative PnL, your real win rate across closed trades, your per-pair and per-session breakdowns — those come from the journal analytics, not from the calculators.
How This Compares to Paid Alternatives
At the time of writing, TradeZella, TraderSync, Tradervue, and Edgewonk all charge monthly or annual fees, or impose trade caps on their free tiers. The cost itself isn't the main objection — a good tool is worth paying for. The problem is that cost friction causes traders to import trades selectively. You start skipping the small losses because "it's not worth logging."
Then your journal only captures your winners, your win rate looks artificially great, and the whole point of the exercise collapses.
Edgelog being genuinely free with no trade limits removes that incentive to cherry-pick. Every trade goes in. The calendar reflects reality.
Reading Your Calendar Without Lying to Yourself
A few things I've learned about actually using a daily PnL calendar rather than just owning one:
- Don't optimize for green boxes. The goal is accurate data, not a pretty calendar. A small red day that you journaled correctly is worth more than a green day you padded by moving your stop after the fact.
- Look at the shape over 30+ days before drawing conclusions. Three bad Mondays might be noise. Seven bad Mondays in a row is a pattern worth investigating — are you overtrading the open? Reacting to gaps?
- Pair the calendar with your notes. Edgelog lets you attach journal notes and chart screenshots to individual trades. When you click a bad day on the calendar, you want context, not just a number.
- Track cumulative PnL in R, not just dollars. Dollar figures shift as your account size changes. R-multiples stay comparable across months and account sizes, which makes the cumulative line actually meaningful over a long time horizon.
If you trade forex specifically, the forex trading journal setup on Edgelog keeps your session tags intact so the calendar can break down by London, New York, and Asia sessions separately. For crypto traders there's an equivalent crypto trading journal flow. Either way, the daily PnL calendar is the same underlying feature — just fed by different data sources.
One Change, Compounding Over Months
I'm not going to tell you a calendar view alone will make you profitable. That'd be overselling a UI feature. What it does is compress months of scattered results into a format your pattern-recognition can actually process. The Friday problem I mentioned took me four years to notice without a calendar.
It took me about six weeks to spot once I had a proper daily PnL grid in front of me.
Small edges — cutting one consistently bad session, avoiding news windows that don't suit your setup — compound over twelve months of trading in ways that a lump-sum monthly P&L figure never reveals.
Suppose you don't have a pnl tracker with a calendar view yet, start a free journal on Edgelog and import your last 90 days. See what the grid looks like. You might find nothing new. Or you might find the thing you've been missing for longer than you'd like to admit.