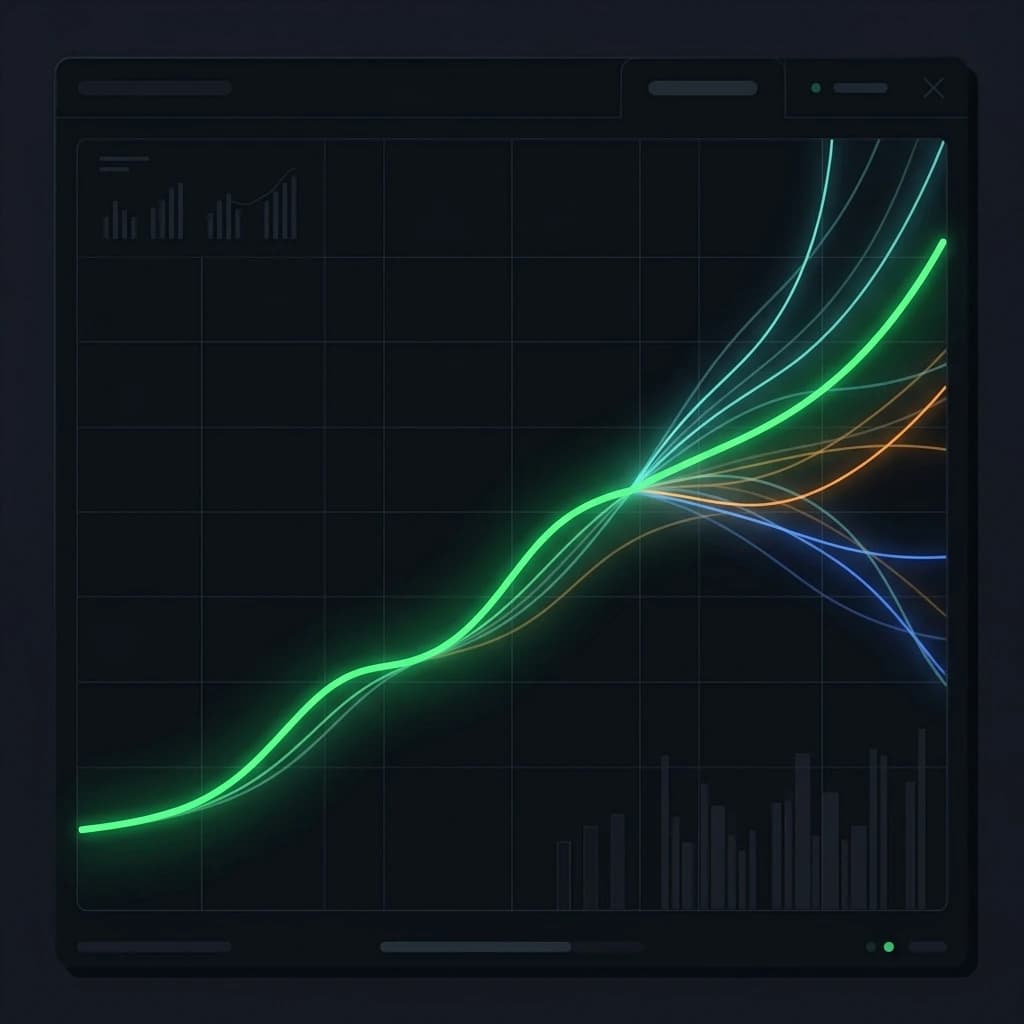
Your strategy has a 58% win rate and a profit factor of 1.7. That looks fine on paper. But if you reshuffled the exact same 200 trades into a different order, how many of those sequences would have wiped your account before trade 100? That's what a Monte Carlo simulation answers — and if you've never run one on your own equity curve, you're making risk decisions on incomplete information.
What a Monte Carlo Simulation Actually Does for Traders
The core idea is simple: take a fixed set of trade outcomes (your wins, losses, and their sizes), randomize the order thousands of times, and record what happens to the account in each simulated run. After 5,000 or 10,000 iterations, you get a distribution of possible equity paths — a best case, a worst case, and everything in between.
What traders care about from those results is usually three things. First, the maximum drawdown across all simulated paths — not just the one you actually experienced, but the worst one the same trade outcomes could have produced. Second, the probability of ruin at a given drawdown threshold (say, losing 20% of your account). Third, the range of ending equity, which tells you how much of your actual performance is repeatable edge versus sequence luck.
This is not backtesting. You're not replaying market data. You're stress-testing an already-proven series of outcomes to understand how fragile or durable the underlying edge really is.
Running a Free Monte Carlo Simulation by Hand (and Why the Inputs Matter)
There's no shortage of free Monte Carlo simulation tools online — a basic spreadsheet can do it. The structure for a manual simulation is:
- List your trade returns as R-multiples (e.g. +1R, +2.3R, -1R, -0.5R).
- Use a random-number function to shuffle that list.
- Calculate the running equity curve for that shuffled sequence.
- Repeat that shuffle 1,000–10,000 times.
- Record the max drawdown and ending equity for each run.
The math in a worked example: say you have 50 trades — 29 winners averaging +1.2R and 21 losers averaging -1R. Win rate is 58% (29 ÷ 50). Profit factor is (29 × 1.2) ÷ (21 × 1.0) = 34.8 ÷ 21.0 = 1.657, call it 1.66. Expectancy is (0.58 × 1.2) + (0.42 × -1.0) = 0.696 − 0.420 = +0.276R per trade. That's a genuine positive edge. But the same 50 trades shuffled into their unluckiest sequence might produce a 14R drawdown before recovering — roughly a 28% account hit if you're risking 2% per trade. A Monte Carlo run surfaces that possibility so it doesn't surprise you mid-run.
Those numbers only mean something if the inputs are honest. A sim built on estimated or cherry-picked trade data will give you a false sense of security. This is where having an accurate, complete trade history matters more than the simulation tool itself.
The Problem With Most Free Monte Carlo Simulators Online
Most free Monte Carlo simulation tools you find online ask you to type in a win rate and average R. That's fine for a rough sanity check, but it flattens two things that matter: the distribution of your winners and losers, and the consistency of your win rate across different market conditions.
A strategy with winners clustering between +0.8R and +1.4R behaves very differently from one with most winners at +0.5R and occasional +4R outliers — even if the average is identical. And a trader who wins 62% on London session setups but only 44% during New York overlap has a very different risk profile than their blended 55% win rate suggests.
The more granular your trade data, the more honest your Monte Carlo inputs. Filtering by setup, by session, by instrument — that kind of breakdown is what turns a generic simulation into something that reflects your actual edge rather than a smoothed approximation of it.
How Your Trading Journal Connects to Equity Curve Stress-Testing
This is where journaling stops being a record-keeping exercise and starts being an analytical one.
If you've logged every trade with setup tags, session tags, and accurate entry/exit prices, you can pull filtered R-multiple lists for specific conditions. That lets you run separate Monte Carlo simulations for different subsets of your trading — your A-setup trades vs. your B-setup trades, for instance, or your high-volatility-session trades vs. your slower-session trades. You might find your A-setup equity curve is extremely durable across 5,000 simulations, while your B-setup curve blows a 25% drawdown threshold in 30% of runs. That's an actionable finding.
Edgelog tracks win rate, profit factor, expectancy, and per-pair and per-setup breakdowns as part of its free journal — you can see your equity curve, your drawdown chart, and your daily P&L calendar without paying anything or hitting a trade cap. It doesn't have a built-in Monte Carlo simulator (that's a tool we're working toward), but the R-multiple data you pull from your journal is exactly what you paste into a spreadsheet sim or a free Monte Carlo simulation tool online.
If you want to start building that data, a free journal on Edgelog costs nothing and syncs automatically from MT4/MT5 via the EdgelogSync EA, or from Binance, Bybit, and OKX via read-only API keys. Nothing to pay, no trial period.
What to Actually Do With the Results
Once you've run a simulation, here's what to look at:
- 5th percentile max drawdown — the worst drawdown outcome across 95% of your simulated paths. Risk your account like this number is real, because it can be.
- Probability of ruin — how many paths hit your personal "I'd stop trading this strategy" drawdown threshold. If that's more than 5–10% of runs, your position sizing is aggressive for the edge you have.
- Ending equity spread — if the gap between your 10th and 90th percentile endings is enormous, a big chunk of your actual returns are sequence-dependent rather than skill-dependent. That's not a reason to quit the strategy, but it is a reason to size conservatively.
A Monte Carlo sim doesn't tell you whether your edge is real. It tells you whether your risk management is robust enough to survive the variance that a real edge still produces. Those are different questions, and both matter.
Making the Simulation Worth Running
The single biggest mistake traders make with Monte Carlo analysis is running it once with rough numbers, feeling reassured, and never revisiting it. Your edge drifts. Market conditions shift. A strategy that cleared a Monte Carlo stress-test on 2022 data might look very different on 2024 data if spread conditions or volatility profiles changed.
Run a fresh simulation every 100–200 trades using your actual logged results, not the original backtest data. Your journal makes that possible — if you've been logging consistently, you always have an up-to-date R-multiple series to work with. Check your profit factor and win rate as baseline sanity checks before each sim run, so you're not feeding deteriorating-edge data into a simulation and misreading the output as confirmation the strategy still holds.
The traders I've seen blow accounts on strategies they knew were profitable almost always skipped this step. The edge was fine. The sequence risk, combined with sizing that left no room for a bad run, is what ended them. A free Monte Carlo simulation won't guarantee you anything — but it'll show you exactly how much room you don't have.
Start logging the trade data that makes a simulation worth running: free trading journal at Edgelog.