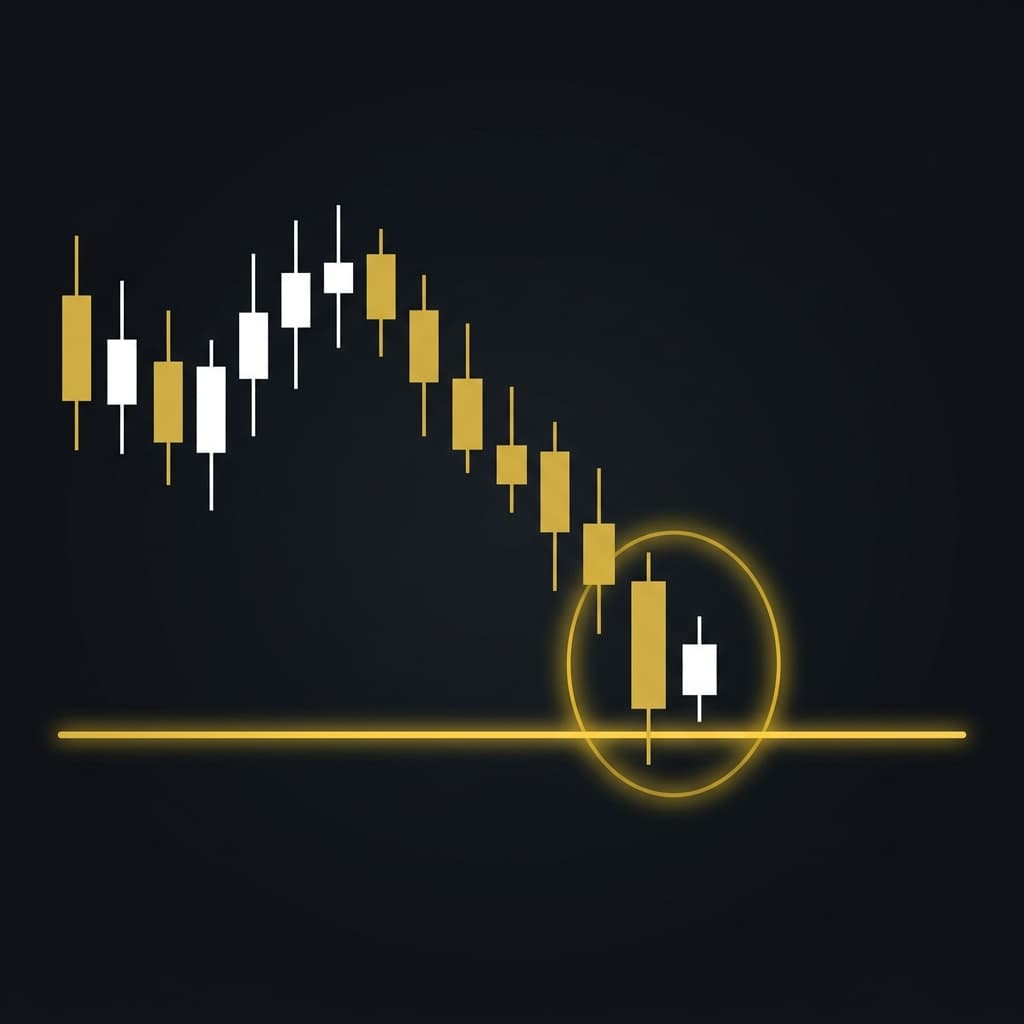
Three trades, all inside bars on the daily chart, all taken within the same week. Two were stopped out within 12 hours. One ran 180 pips. That kind of inconsistency used to drive me crazy until I started breaking down exactly which conditions made the setup work and which ones were just noise dressed up as a signal.
The inside bar strategy is genuinely one of the highest-probability price action setups available to retail traders, but only when you apply it with context. Without that context, you're essentially flipping a coin with a 1.5R payout — and that's not an edge, that's gambling with good-looking charts.
What an Inside Bar Actually Is
An inside bar forms when an entire candle — high to low — sits within the range of the previous candle. That previous candle is called the mother bar. The inside bar is the one contained inside it.
The setup signals price compression. The market is pausing, digesting a recent move, and coiling before it picks a direction. That's the theory, anyway. The reality is more nuanced.
What matters is where that compression is happening. An inside bar printing in the middle of a choppy range tells you almost nothing. An inside bar forming at a clean daily support level after a 200-pip impulse move down? That's a different conversation.
The Multi-Timeframe Filter That Changed How I Trade This Setup
For years, I took inside bars on the daily chart without checking higher timeframes. My win rate on the setup was hovering around 42%, which sounds fine until you account for the losing streaks — four losses in a row were not unusual, and each one chipped at both my account and my conviction.
The filter I now apply before every inside bar entry is simple:
- Weekly chart bias — Is the weekly candle trending clearly in one direction, or is it ranging? I only take inside bar breakouts in the direction of the weekly trend.
- Structure level confluence — the mother bar should either start at, end at, or contain a recognizable support/resistance level from the daily chart.
- Mother bar quality — A strong directional mother bar (a wide-range candle with a clear close) gives the inside bar more meaning than a doji acting as the mother.
Applying all three filters reduced my trade frequency considerably, but the setups that qualified became materially cleaner. That's not a claim about universal win rates — it's a framing for how to think about selectivity. If you're tracking your results properly, you'll see the same pattern in your own data.
The Three Main Inside Bar Variants
Not all inside bars are the same, and lumping them together in your journal is a mistake.
The Single Inside Bar
One contained candle after a strong mother bar. This is the textbook version. Entry is typically placed a few pips above the mother bar high for a bullish breakout, with a stop just below the mother bar low. On EURUSD daily, that might mean a 60-pip stop for a target of 120 pips — a clean 1:2 risk-to-reward.
Using the risk-reward calculator before sizing into any trade is worth doing, even if the math feels automatic at this point. A 60-pip stop on a 1% account risk of $500 tells you the position size precisely, and that's where the position size calculator earns its keep.
The Double or Triple Inside Bar
Sometimes you'll see two or even three consecutive inside bars stacking inside the same mother bar. This is tighter coiling, and the breakout, when it comes, can be sharper. I've seen GBPJPY produce 250-pip moves out of a triple inside bar on the daily. I've also seen them fizzle immediately.
The key distinction: the longer the price coils, the more convincing the breakout needs to be. A weak, wicked breakout candle after a triple inside bar pattern is a reason to sit on your hands, not a reason to jump in.
The Inside Bar Reversal
This one gets misread constantly. An inside bar forming after an extended trend can signal exhaustion, but only if it's appearing at a major level — a previous monthly high, a 61.8% Fibonacci retracement, a weekly order block. Without that structural anchor, calling it a reversal setup is wishful thinking.
A Worked Example With Real Numbers
To make this concrete, here's an illustrative worked example using round figures — not a claim about any specific past trade, just clean math to anchor the concepts.
Suppose you take 40 inside bar setups over three months, applying the multi-timeframe filter above. Say 20 of them win at an average of 1.8R, and 20 lose at an average of 1R.
Win rate: 20 ÷ 40 = 50%
Profit factor: (20 × 1.8R) ÷ (20 × 1R) = 36R ÷ 20R = 1.80
Expectancy: (0.50 × 1.8R) − (0.50 × 1R) = 0.90 − 0.50 = +0.40R per trade
That's a legitimate edge. Not spectacular, but real. Now imagine you run the same exercise without the filters and your win rate drops to 42% while your average winner shrinks to 1.5R (because you're entering with worse confluence and exiting early from anxiety).
Expectancy drops to (0.42 × 1.5) − (0.58 × 1.0) = 0.63 − 0.58 = +0.05R — barely above breakeven once you account for spread and slippage.
The difference between a profitable inside bar strategy and a losing one often comes down to exactly that margin.
Why Journaling This Setup Specifically Matters
The inside bar strategy looks clean in hindsight. That's part of the problem. It's extremely easy to look back at a chart and see only the setups that worked, which gives you a warped sense of your own execution.
What you need is contemporaneous data: entry time, entry price, stop, target, which variant it was (single/double/reversal), whether you applied the HTF filter, the session it triggered in, and the actual outcome in R.
With that data tracked consistently, you can start answering questions like: do I win more on inside bars that trigger in the London open versus New York? Do double inside bars outperform single ones in my sample? Does my win rate on reversal inside bars justify trading them at all?
I track all of this in Edgelog. It's completely free — no credit card, no trade cap, no trial period.
You can tag each trade with a setup type (like "inside bar — single" or "inside bar — reversal"), attach a screenshot of the chart at entry, and let the analytics surface your actual win rate, profit factor, expectancy, R-multiples, equity curve, and drawdown across however many trades you've logged. If you're on MT4 or MT5, the EdgelogSync EA pushes closed positions in seconds.
The profit factor calculator and the win rate calculator are also available as standalone tools on the site if you want to run quick numbers from a spreadsheet without importing a full trade set.
The One Thing Most Traders Skip
Here's my actual stance on this: most traders who struggle with the inside bar strategy don't have a pattern recognition problem. They can identify the setup just fine. What they're missing is a documented rule set that they've tested against their own results over at least 50 trades.
Fifty trades is the floor. Anything less and you're concluding noise. The traders I've seen genuinely improve their inside bar win rate aren't doing it by finding a better YouTube tutorial. They're doing it by pulling up their journal, filtering by setup tag, and being honest about what conditions preceded their losers.
If your journal doesn't let you do that kind of filtering, it's not really a journal — it's just a log. There's a meaningful difference.
For more on building that kind of journaling habit, the post on five trading journal habits that improve win rate covers the mechanics in detail.
The setup itself is sound. The edge is real. Whether your execution of it is profitable is a question your data has to answer — and the only way to get that data is to start tracking now.