Most traders who try Keltner bands give up on them within a week. They slap the indicator on a chart, watch price bounce off the upper band once, get excited, and then get stopped out three times in a row during a trend. That's not a flaw in the tool — it's a flaw in how they're using it.
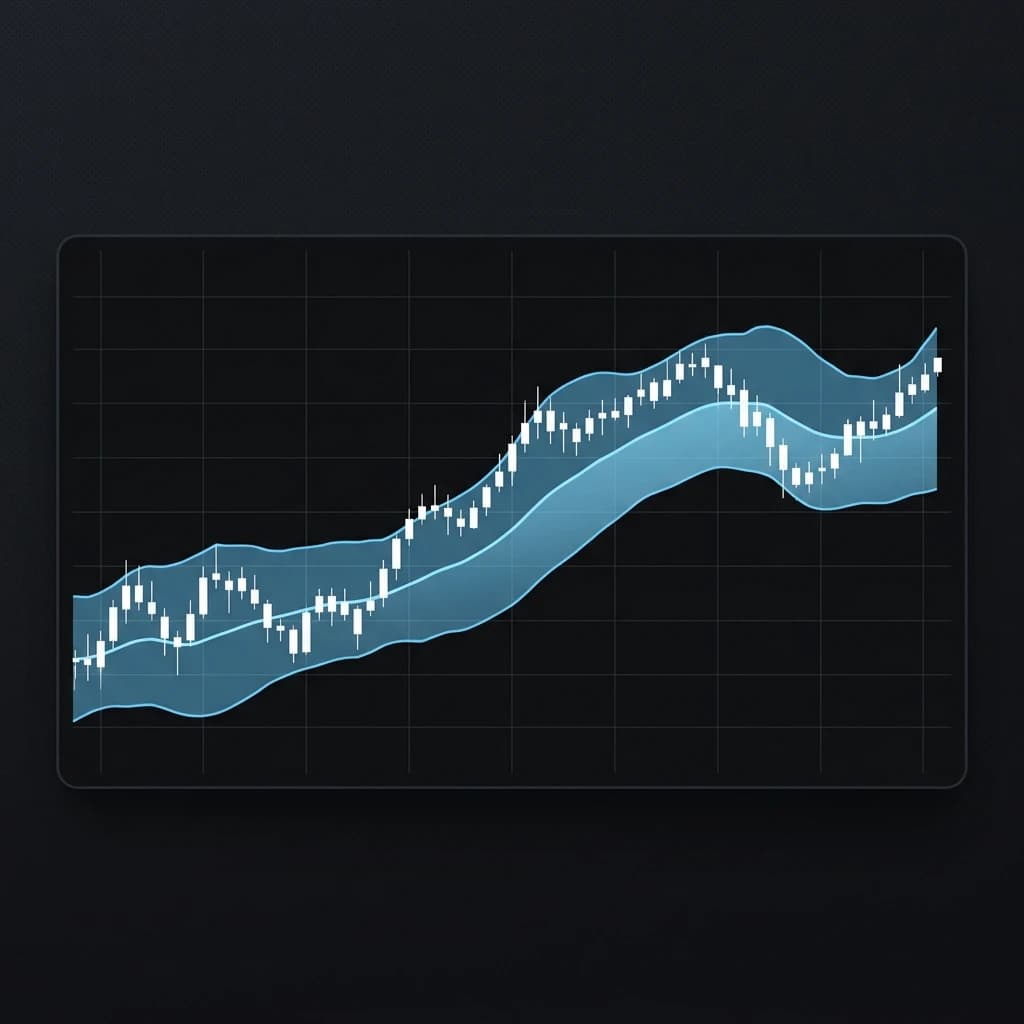
The Keltner channel is a volatility envelope built around an exponential moving average, with the upper and lower bands set at a multiple of the Average True Range above and below that midline. The most widely used default is a 20-period EMA with bands at 2× ATR.
Unlike Bollinger Bands, which expand and contract with standard deviation, Keltner channels tend to be smoother and a bit slower to react — which is actually an advantage if you know what you're looking for.
What Keltner Bands Are Actually Measuring
The midline is the EMA. The bands are just that EMA shifted by a volatility buffer. When price closes outside the upper or lower band, it doesn't automatically mean the market is overbought or oversold — it means volatility has pushed price into territory that's statistically uncommon given current ATR. That distinction matters enormously for how you trade the setup.
Chester Keltner introduced an earlier version of this channel in the 1960s, though the ATR-based version widely used today is often credited to Linda Bradford Raschke, who adapted and popularized it. That later refinement is what made the channel genuinely useful for modern short-term trading.
The Three Setups Worth Trading
1. The Band Ride (Trend-Continuation)
This is the setup most traders don't wait for patiently enough. In a strong trend, price doesn't just touch the upper band — it walks along it for multiple candles, sometimes for 30, 40, even 60+ pips on a 1H EUR/USD chart without closing back below the EMA.
The entry trigger isn't the touch; it's the first pullback to the midline EMA that holds and closes back toward the band.
Patience is the whole job here. I've sat on my hands through four consecutive candles touching the EMA before the fifth confirmed the continuation. Most traders have already chased two false reversals by that point.
Stop placement: just below the previous swing low, outside the opposite band if the range is tight. Target: the prior extreme of the band ride, or a fixed 2R minimum.
2. Mean Reversion from the Outer Band
This only works in a clearly defined market. If you try to fade the upper band while the price is in a trend, you'll get carried out. The filter I use before taking any mean-reversion trade is simple: the 20-period ADX needs to be below 20.
A reading below 20 on ADX tells me the trend has no real conviction, and the probability of a snap-back to the midline is meaningfully higher.
Setup: price closes outside the upper or lower band on a 4H chart, ADX is below 20, and the next candle opens back inside the band. Enter on that open, stop outside the wicked extreme, target the opposite band, or at minimum the midline EMA.
This is a setup where your risk-reward calculator earns its keep before you ever place the order. The math on these trades can look deceptively good — a wide band gives you a big apparent target —, but you need to make sure the stop isn't so tight it gets taken out by normal noise.
3. The Squeeze Breakout
When the keltner channel narrows significantly — bands compressing toward the EMA over several sessions — it signals that ATR is contracting. These quiet periods often precede explosive moves. The Keltner Squeeze is most useful when you combine it with ADX rising from a low base (say, crossing back above 15 after sitting under 20 for a week).
The trade: wait for a close outside the band after a compression period, then enter on the retest of the band from the outside. This avoids chasing the initial spike, which is almost always overextended.
A Worked Example: EUR/USD, November 2022
November 3rd, 2022. EUR/USD had been compressing in a tight range on the 4H chart for roughly five sessions — daily ATR was around 100 pips, but the 4H candles were closing in a 40-pip band. The Keltner channel had visibly narrowed.
On November 4th, the NFP release pushed the price outside the upper band in a single 4H candle. Assuming a 2× ATR setting with ATR at approximately 65 pips on the 4H at that moment, the upper band was sitting near 0.9985. Price closed at 1.0030 — clearly outside the band.
The retest came later in the same session: price pulled back to the upper band level, held, and closed above it again. Entry there, stop at 0.9940 (below the prior session low, roughly 45 pips of risk), initial target at 1.0120 — giving a risk-reward of approximately 2:1 on a 90-pip potential gain. The move extended to 1.0095 before stalling, delivering around 1.7R.
Not perfectly clean, but a real trade on a real day.
The point isn't that the exit was perfect. It's that the structure — compression, breakout, retest — was identifiable before the move, not in hindsight.
Why Journaling This Strategy Specifically Matters
Keltner channels strategy has a quirk that makes it unusually hard to evaluate from memory: the setup quality is highly context-dependent. A band touch in a trending market and a band touch in a ranging market look nearly identical on a screenshot. You cannot reliably remember, three weeks later, what ADX was reading when you entered.
This is exactly why logging these trades — the ATR at entry, the ADX reading, whether you were trading the band ride or the mean reversion, your session — turns anecdote into data. After 20 or 30 logged Keltner trades, patterns emerge that you'd never spot otherwise.
Maybe your band-ride trades in the London session are profitable, but the same setup in New York is breaking even. That's actionable. That's the difference between grinding and improving.
Edgelog lets you tag each trade by setup type, so you can filter your Keltner channel trades separately from everything else and look at win rate, profit factor, and expectancy in isolation.
It's free — no trial period, no trade cap, no credit card — and it syncs automatically with MT4 and MT5 via the EdgelogSync EA, or you can connect Binance and Bybit through read-only API keys. For any other broker, CSV import handles it.
If you're already tracking trades somewhere, you might also find the profit factor calculator useful for a quick gut-check on whether your Keltner setups are pulling their weight before you go deep on analysis.
The Honest Reality of This Indicator
Keltner channels aren't magic. No indicator is. What they do well is give you a structured way to define volatility context — and once you have that, you can ask more useful questions about your trades. Am I trading with the trend or against it? Is this market actually ranging, or am I forcing a mean-reversion thesis? Is the ATR expanding or contracting?
The traders I've seen struggle most with Keltner channels are the ones who treat the bands as buy/sell signals rather than as context. The band is not a trade. The band, combined with price action, ADX, and a clear read on the session structure — that's where the setup lives.
If you want to find out whether keltner channel trading actually suits your style, start logging every trade you take using the setup. Give it 30 trades minimum. Use the win rate calculator to track your running numbers. The data will tell you something your gut won't.
Start a free journal at Edgelog — no card, no trial, just your trades and your numbers from day one.