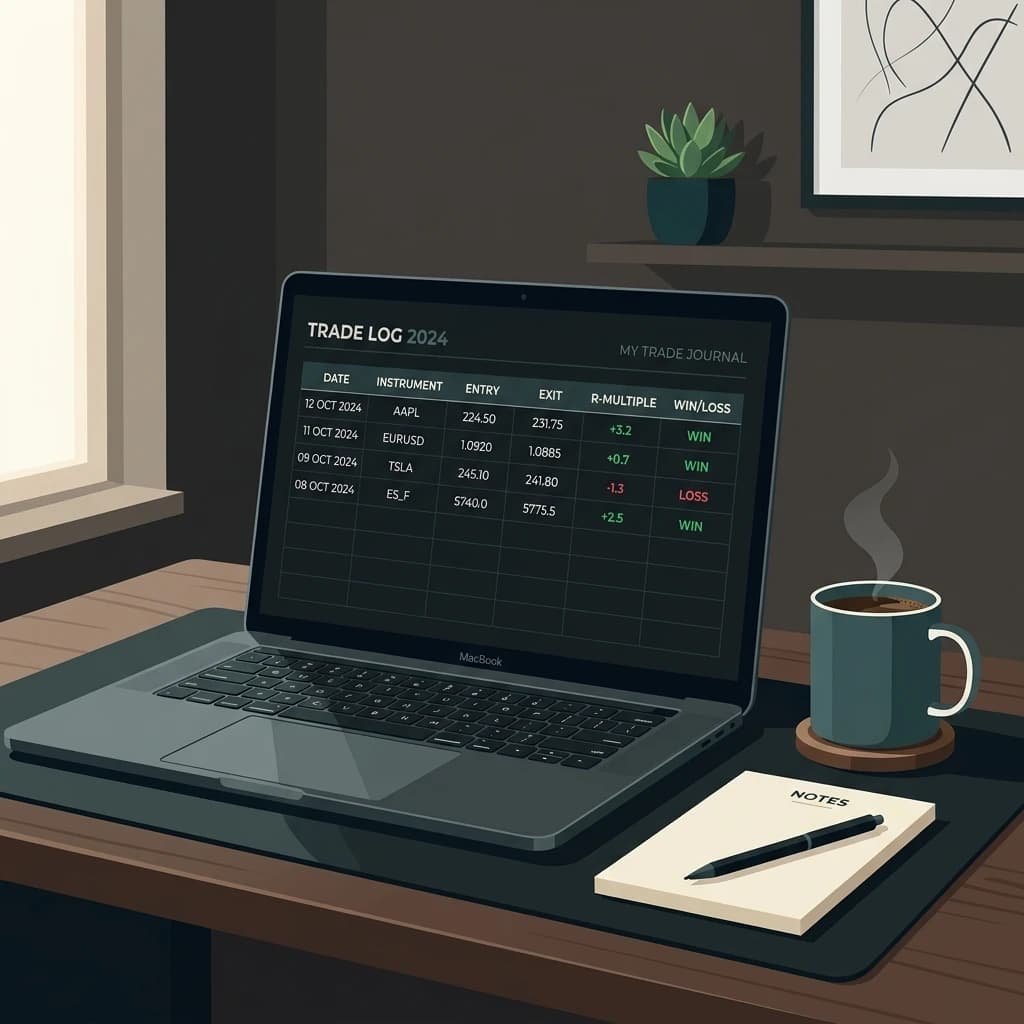
A blank spreadsheet is a dangerous thing. Most traders open a new Google Sheet, type "Date", "Pair", "P&L" — and stop. Two weeks later the file is a graveyard of orphaned numbers that tell you nothing about why you won or lost. The problem isn't discipline. It's that your trade journal spreadsheet template columns were never designed to expose your edge in the first place.
A real trading journal captures the decisions, not just the outcomes. If your log only records price and profit, you are blind to the patterns that actually drive your P&L. Below are the eight columns — drawn from hundreds of real journal entries across forex and crypto — that separate a useful trade journal template from a decorative one. Each one earns its place by answering a specific question about your process.
The eight columns your trading journal template needs
These eight fields cover every angle of a trade: entry logic, risk structure, execution quality, emotional state, and post-trade review. You can build them in a trading journal template excel file, a Google Sheet, or any digital log — the format matters less than the consistency of the data.
1. Date & time (session-aware)
Record the open time and close time in your local zone, but also tag the session: London open, New York close, Asian session, or crypto overlap. A 0.5R win on EUR/USD at 3 AM vs the same setup at 8 AM London open are different trades. The excel trading journal template should let you filter by session so you can see if your edge concentrates in one window.
2. Instrument & direction
Simple, but often sloppy. Use a standard format: EURUSD (not EUR/USD), BTCUSDT, XAUUSD. Long or short. If you trade multiple brokers, include the broker tag too — a free trading journal excel file needs this to reconcile P&L across accounts.
3. Entry price, stop loss, take profit
These three are non-negotiable. Your stop and target define the R-multiple before the trade even starts. Without them, you cannot calculate expectancy later. A trading journal template google sheets setup should auto-calculate R from these three cells — if you are typing R manually, you are introducing rounding errors.
4. Risk amount (in account currency)
How much of your account did you actually risk? Not the pip distance, not the contract size — the dollar (or USDT) amount. This is the single most underreported field in amateur logs. A day trading journal template that omits risk amount can show a 70% win rate while you are bleeding equity, because your losers are 3x bigger than your winners.
5. R-multiple (realized)
Once the trade closes, the actual R-multiple equals (realized P&L) / (risk amount). A 2R winner is a 2R winner whether you made $20 or $2,000. Normalizing every trade to R lets you compare a 5-lot scalp on EURUSD to a 0.1-lot swing on GBPJPY on the same scale. Your trading journal excel template should have this as a formula column — never type it by hand.
6. Setup or strategy tag
This is where the journal starts paying for itself. Tag every trade with the specific pattern or signal that triggered it: "Pin bar at support", "EMA crossover 1H", "Order block break 15m", "Funding rate spike". Over 50–100 trades, you will see which setups actually produce positive expectancy and which ones are just noise. A day trading journal without setup tags is a scoreboard, not a diagnostic tool.
7. Screenshot link or chart note
A column for a file path or Google Drive link to the chart screenshot at entry. Text descriptions decay — a picture of the exact candle structure, indicator placement, and volume profile is permanent. If you use a google sheets trade journal, embed the image link directly in the cell. Reviewing a losing trade six weeks later without the chart is useless.
8. Emotional & execution quality score
Rate your emotional state before entry on a 1–5 scale (1 = tilted, 5 = calm). Also rate execution quality: did you enter at the planned level, or did you chase? Did you move the stop? A google sheets trading journal template that tracks these two scores will reveal whether your best trades happen when you are calm and disciplined — and whether your worst losses cluster around emotional entries.
Why a day trading log template needs more than P&L
A day trading log template that only records profit and loss is a receipt, not a journal. Receipts tell you what you spent. A journal tells you what you learned. The difference between a trader who improves and one who plateaus is the ability to see patterns across hundreds of trades — and that requires structured data, not just dollar amounts.
Consider a typical scenario: you take 200 forex trades over three months. Your overall win rate is 48%, and your profit factor is 1.1. That is mediocre, but you cannot tell why. If your trading journal excel includes session tags, you might discover that your win rate on London open trades is 62% and your Asian session win rate is 34%. Now you have a concrete adjustment: skip Asian hours, double down on London. Without the column, the data is invisible.
Building your template in Excel vs Google Sheets
Both tools work. An excel trading journal gives you offline access and robust pivot tables. A google sheets trading journal lets you share the file across devices and collaborate with a mentor or accountability partner. The column structure is identical either way.
If you use Excel, set up named ranges for each column and use SUMIFS or AVERAGEIFS to calculate per-setup statistics. In Google Sheets, the QUERY function does the same job. Either way, keep the data tab clean — one row per trade, no merged cells, no blank rows between entries. A trading journal excel template that breaks when you sort by date is not worth the time.
The one column most traders skip (and regret)
The exit reason column. Why did you close the trade? Was it a hard stop, a trailing stop, a manual exit at target, or a discretionary early close? If you consistently close winners early and let losers run, that column will expose the habit. Add it as a ninth column if you want — it costs nothing and can reveal your biggest leak. A day trading journal template that includes exit reason is a rare and powerful thing.
How Edgelog handles these columns automatically
Building a spreadsheet from scratch and keeping it updated is tedious. Every manual entry is a chance to mistype, forget, or skip a field. That is why Edgelog exists as a trading journal excel alternative that syncs your trades automatically from MT4, MT5, Binance, and Bybit — no CSV imports, no copy-paste errors.
Every column above is already in Edgelog's analytics dashboard: session breakdowns, R-multiple distributions, setup-based win rates, and emotional tagging. You get the structure of a trade journal template without the maintenance. And it is 100% free — unlimited trades, unlimited accounts, no credit card, no trial clock. You can even export your data to a trading journal template google sheets if you still want local copies.
If you trade forex via MT4 or MT5, the EdgelogSync EA attaches to any chart, pastes your sync key, and closed positions appear in seconds. For crypto traders, read-only API keys connect Binance and Bybit — no withdrawal access, no risk. Hedging and netting accounts work. Even prop-firm logins sync without issues.
Start with the right columns, then refine
A trade journal spreadsheet template columns list is only the beginning. Once you have 50–100 trades logged with all eight fields, run the per-setup breakdown. If your "Pin bar at support" setup shows a 1.8 profit factor over 30 trades, that is an edge worth scaling. If your "EMA crossover" setup shows negative expectancy after 40 trades, drop it. The columns make those decisions possible.
You do not need a paid platform to get this data. A simple free trading journal excel file with these columns will outperform a $50/month journaling app that only tracks P&L. But if you want the same structure without the manual data entry, Edgelog gives you the analytics in real time — and keeps your spreadsheet optional.
Ready to stop guessing and start measuring? Sign up for free at Edgelog and let the platform handle the columns while you focus on the trades. You can also use our position size calculator to nail your risk amount before every entry.