Most retail traders lose money not because they lack discipline, but because they're reading the wrong map. SMC trading — smart money concept trading — argues that the candlestick patterns and indicator signals the majority of traders rely on are, at best, a lagging reflection of what institutional order flow has already decided.
After 15 years of journaling my own trades across forex and crypto, I think that framing is mostly right, even if the SMC community has built an entire mythology around it that sometimes obscures the genuinely useful core.
So, what is smart money concept trading, exactly? At its cleanest, it's a framework for reading price through the lens of institutional accumulation and distribution — identifying where large orders were placed, where liquidity is being hunted, and then positioning in alignment with that flow rather than against it.
The Core Building Blocks of Smart Money Concept Trading
SMC has a specific vocabulary, and it's worth defining the terms precisely before anything else, because the internet is full of people using them interchangeably when they mean different things.
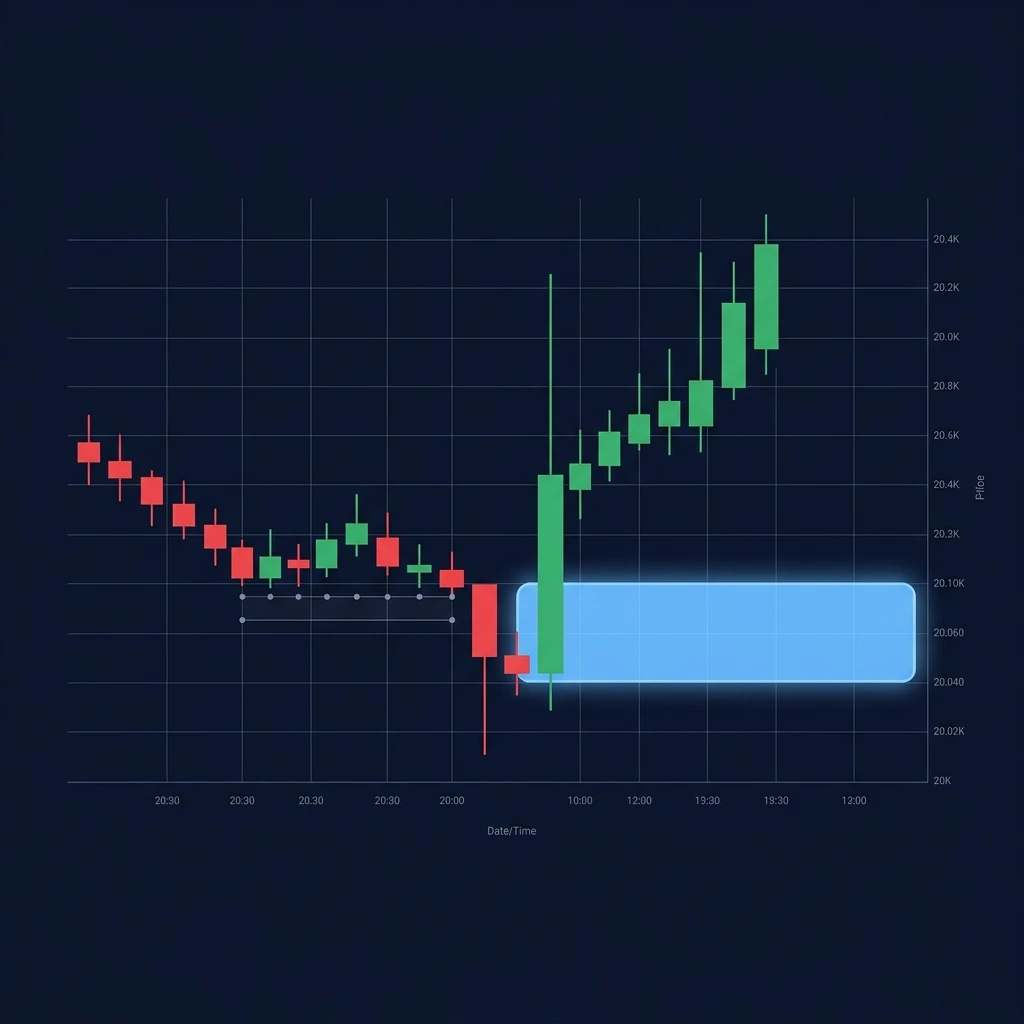
Order blocks (OBs) are the last opposing candles before a strong impulsive move. If price rips 80 pips to the upside from a tight consolidation zone, the final bearish candle in that consolidation is your bullish order block. The theory is that institutional buy orders were placed there, and the price is likely to return to that zone before continuing higher.
Fair value gaps (FVGs) are three-candle imbalances where the wicks of the first and third candles don't overlap — leaving a literal gap in price that was never traded. These form during high-momentum moves and often act as magnet zones when the price eventually retraces.
Liquidity, in SMC terminology, refers to clusters of stop-loss orders sitting just beyond obvious technical levels — above equal highs, below equal lows, and beyond trendline touches. Smart-money concept traders watch for the price to sweep these zones aggressively before reversing.
Break of structure (BOS) and change of character (CHoCH) define trend direction. A BOS is a straightforward higher high or lower low confirming continuation. A CHoCH signals a potential reversal — the market has broken the opposing swing for the first time, hinting that the institutional bias may have shifted.
These four concepts are the actual engine of SMC. Everything else — ICT concepts, inner circle trader terminology, the dozen sub-labels that different educators attach — is essentially elaboration on these fundamentals.
A Dedicated Look at How Smart Money Concept Setups Actually Trigger
Let me walk through how a textbook SMC entry unfolds, using a scenario I've seen play out dozens of times on GBPUSD during the London open.
Imagine price has been grinding higher through the Asian session, printing a series of clean higher highs. Just below the most recent swing low — say, around 1.2740 — there's a dense cluster of buy-stop orders from traders who went long on the breakout and placed their stops underneath.
Price drives down through 1.2740 during the first 20 minutes of London, sweeping those stops and triggering a cascade of sell orders. That's the liquidity grab.
Now look left. At 1.2730, there's a bullish order block — the last bearish candle before the original impulsive move that created this whole structure. Price wicks into that OB, and inside it, you'll often find an FVG from the original move that never got filled. Confluence.
The CHoCH comes when price takes out a short-term high on a lower timeframe — say the M5 — after the sweep. That's the entry signal for many SMC traders. Stop sits below the liquidity low, target is back at the high of the range or the next significant draw on liquidity.
Pips-wise, the setup might offer 40 pips of risk for 100+ pips of reward in a clean environment. The math on paper is attractive. The execution in real time is where most traders fall apart — and that's a journaling problem more than a strategy problem.
What Is Smart Money Concept Trading Without a Journal? Just Theory.
Here's my actual stance on SMC: the framework gives you a coherent way to read price, but it will not make you profitable by itself. I've seen traders who could lecture for an hour on order blocks and still blow accounts, because they had no feedback loop. They didn't know which of their setups were working and which weren't. They had hunches instead of data.
Imagine seeing your OB-only trades laid out against your liquidity-grab-into-OB confluence trades side by side — tagged, sorted by setup type, with win rates and expectancy calculated automatically. That comparison might show you that your simple OB entries are breaking even while the confluence setups are carrying your whole month. Or it might show the opposite. The point is you'd know, rather than guess.
That's the feedback loop that turns SMC from a narrative into an actual trading edge.
This is exactly why I built my own journaling habit around setup tagging before any dedicated tool existed for it. Now, some tools do it properly. Edgelog is one of them — and it's completely free, no trial clock, no credit card, unlimited trades.
You can tag each trade with a custom setup label (OB, FVG, liquidity sweep, OB+FVG confluence, whatever naming convention your strategy uses), add session tags, mood tags, and chart screenshots, then let the analytics break down your performance by tag. Win rate, profit factor, expectancy, R-multiples per setup type — it's all there.
Calculating Your SMC Edge: The Numbers That Actually Matter
Let's say you've been journaling for three months and your tagged data shows: your liquidity-sweep-into-OB setups have a 45% win rate, with winners averaging 2.4R and losers averaging 1.0R.
Expectancy: (0.45 × 2.4) − (0.55 × 1.0) = 1.08 − 0.55 = 0.53R per trade.
That's a genuinely positive expectancy. Over 100 trades, you'd expect to net roughly 53R — which could mean thousands of dollars depending on your position sizing. But you only know that number because you journaled every trade with a consistent tag. Without the tag, the winning liquidity-sweep trades are lost inside your aggregate stats, invisible.
For position sizing on those setups, Edgelog's position size calculator handles the math — enter your account size, risk percentage, and stop distance in pips and it spits out the lot size. Straightforward, standalone, no account connection required.
If you want to stress-test your reward ratios before taking a trade, the risk-reward calculator is also free on the site.
Common SMC Mistakes That Only Show Up in the Data
A few patterns I've noticed after years of reviewing SMC journals — my own and others':
- Trading OBs without a liquidity sweep first. The OB is a point of interest, not a guarantee. When the price reaches an OB without having first swept a notable liquidity pool, the setup tends to underperform because institutional interest may not actually be there.
- Ignoring session context. An FVG formed during the New York close means something different from one formed during the London open. SMC setups live and die by liquidity conditions, and liquidity is heavily session-dependent.
- Overcomplicating the structure. I've watched traders label 12 nested order blocks on a single chart and then be paralyzed about which one to trade. The cleaner the structure, the more reliable the setup, generally.
- No defined draw on liquidity. Taking an OB entry without knowing where price is actually headed — what liquidity target it's drawing toward — means you're entering a car without a destination. You'll exit randomly.
These mistakes are almost impossible to correct without data. With a properly tagged journal, the patterns become obvious within a few weeks of consistent logging. You can see which session your FVG entries perform best in, or whether your structure-heavy setups are actually dragging down your overall profit factor.
Getting Started With SMC Journaling
If you're trading SMC setups on forex or crypto and you're not journaling them with setup-level tags, you're essentially flying without instruments. The strategy gives you a framework for reading markets; the journal tells you whether you're reading it correctly.
Edgelog syncs automatically with MT4 and MT5 via the free EdgelogSync Expert Advisor — attach it to a chart, paste your sync key from Settings, and closed positions appear in your journal within seconds. For Binance, Bybit, and OKX, read-only API keys handle the sync. Any other broker can import via CSV.
Once your trades are in, you tag them, and the analytics do the rest.
If you want more on the journaling mechanics, the guide on how to journal your forex trades effectively covers the habit side in depth. And if you've been considering a paid journal like TradeZella or TraderSync — at the time of writing, both operate on paid or trade-capped models — the free vs paid trading journal breakdown is worth reading before you commit to anything.
SMC trading rewards patience and precision. So does journaling. The two were made for each other — start logging your setups for free and find out what your data actually says about your edge.